In short
- Shopify counts the orders your store took. Each ad platform counts the orders that came after its own ads, by its own rules.
- Eight things push the totals apart: windows, views, overlap between platforms, dates, time zones, modeled conversions, missed or doubled tracking, and what counts as a purchase.
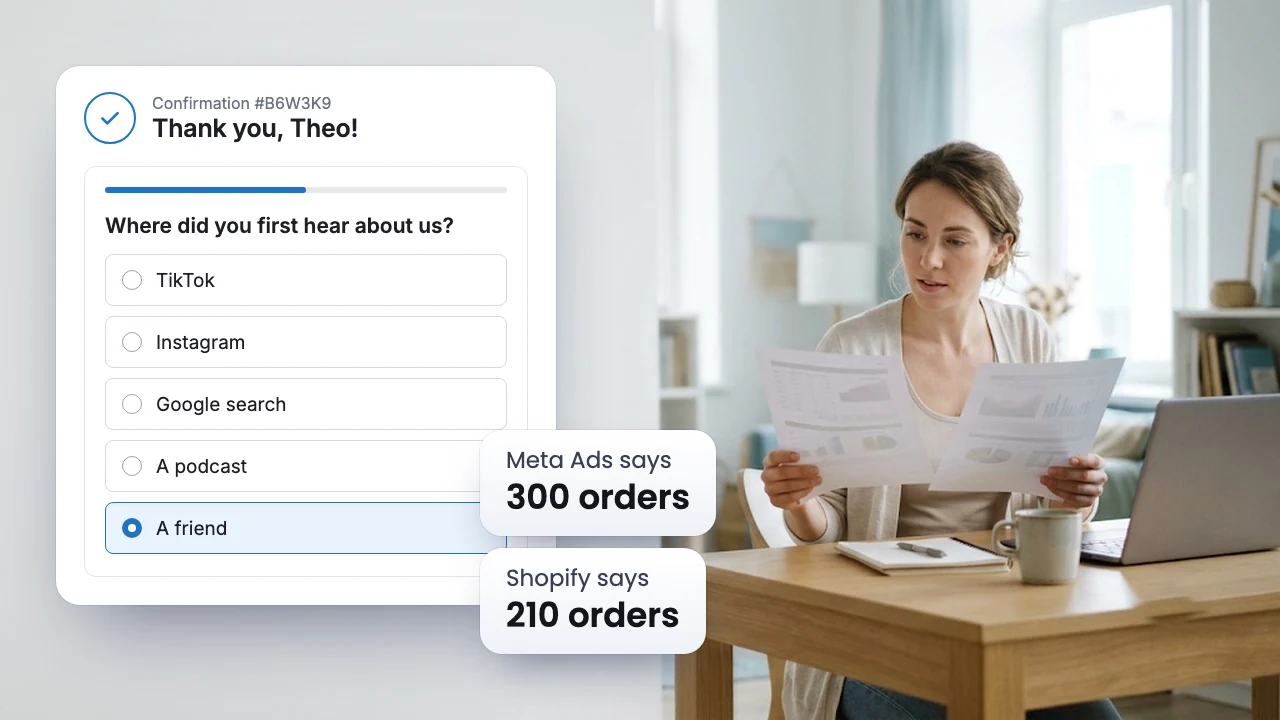
- Add up what Meta, Google and TikTok report and you will usually get more orders than you took. That is normal.
- Watch the ratio between a platform and Shopify week by week. A steady ratio is fine. A sudden jump with no change on your side points to broken tracking.
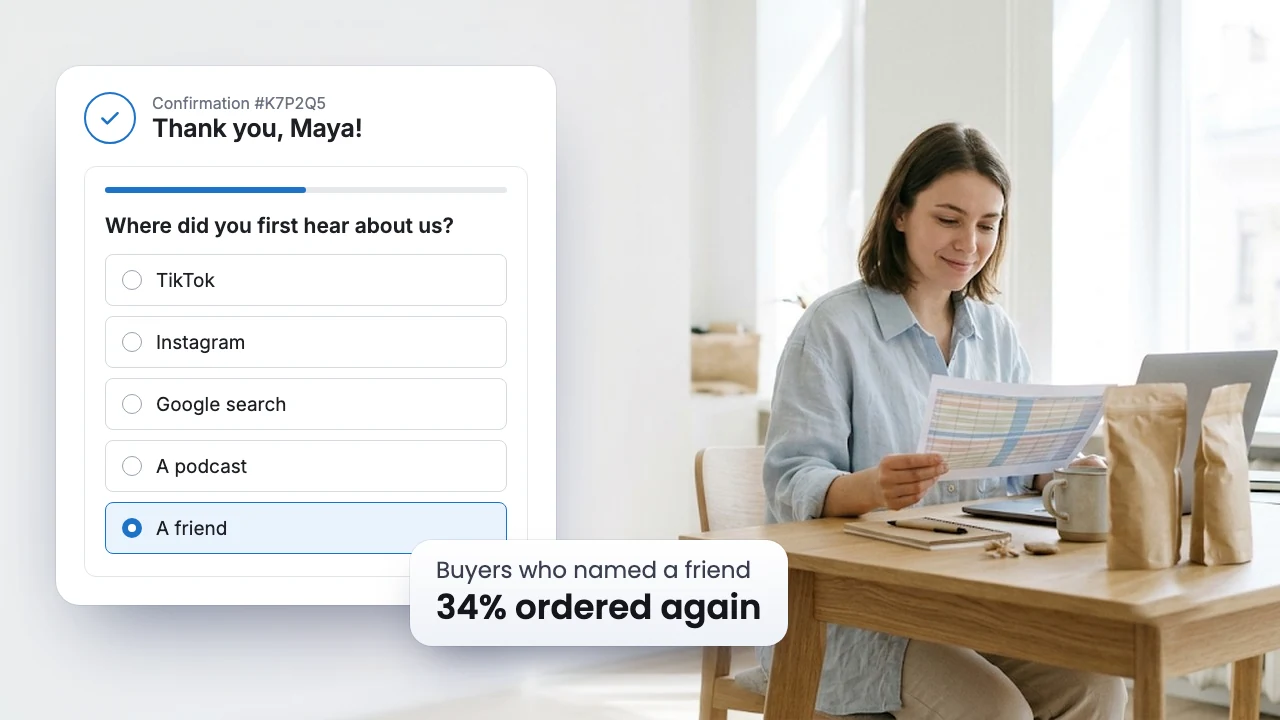
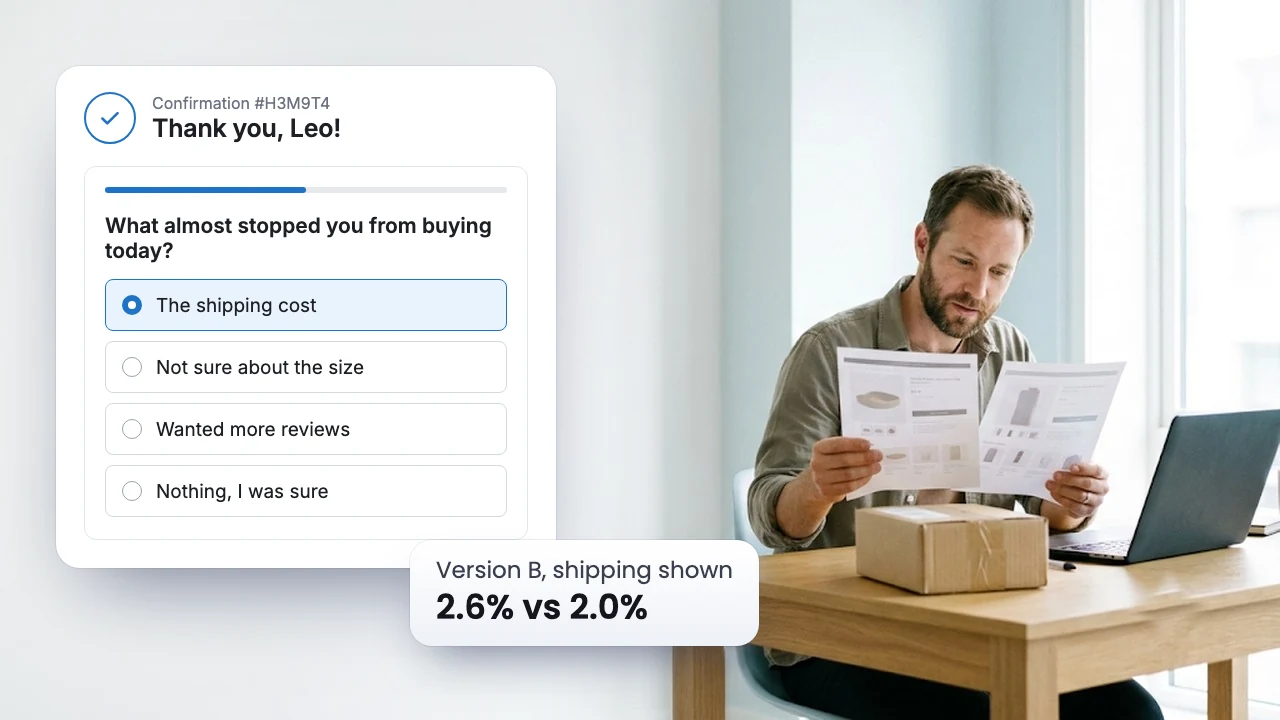
- No click report sees why the buyer came. A post purchase survey app asks them on the Thank you page.
Each report answers a different question
Marketing attribution reports only agree when they count the same thing, and they rarely do. Before comparing numbers, it helps to know what each one is counting.
| Report | The question it answers | What it cannot see |
|---|---|---|
| Shopify orders | How many orders did the store take? | Where buyers came from |
| Shopify Attribution | Which marketing visit came before each order, by the model you pick? | Ads people saw but never tapped |
| GA4 | Which channel brought this visitor and this purchase, by Google's rules? | Visitors who block its tag or decline cookies, unless Google models them |
| Meta, Google Ads, TikTok | How many orders came after our own ads? | Other platforms' ads, and buyers it cannot match to an ad |
| A post purchase survey app | What does the buyer say brought them? | Buyers who skip the question |
Shopify says it plainly in its own help center: each platform credits sales by its own rules, so a buyer who clicked both your email and your Google ad can be counted by both. So the goal is not to make the numbers match. The goal is to know why they differ, and to notice when the difference changes.
Eight reasons the numbers drift apart
1. Each tool counts for a different number of days
Meta counts a sale for 7 days after a link click. Google Ads counts for 30 days, Klaviyo for 5 days after an email open, and GA4 looks back 90 days before a purchase. An order 10 days after a Meta ad tap shows up in Shopify and GA4 but not in Meta. We list every default in attribution windows explained.
2. Ad platforms also count people who only saw the ad
Meta, TikTok, Pinterest and Google Ads give an ad credit for a sale up to a day after someone saw it without tapping, and Meta also counts likes, shares, saves and short video views. Shopify and GA4 only count visits. In Google Ads, sales after a view sit in the All conversions column, not in Conversions, so check which one you are reading.
3. Two platforms claim the same order
Each platform sees only its own ads, so it claims every order that came after them. A buyer who tapped a TikTok ad on Monday and a Google ad on Thursday is one order in Shopify and two orders in your ad accounts.
In one made up month, Shopify shows 1,000 orders. Meta Ads Manager reports 610, Google Ads 420 and TikTok 190. Added up, the platforms claim 1,220 orders, 220 more than the store took.
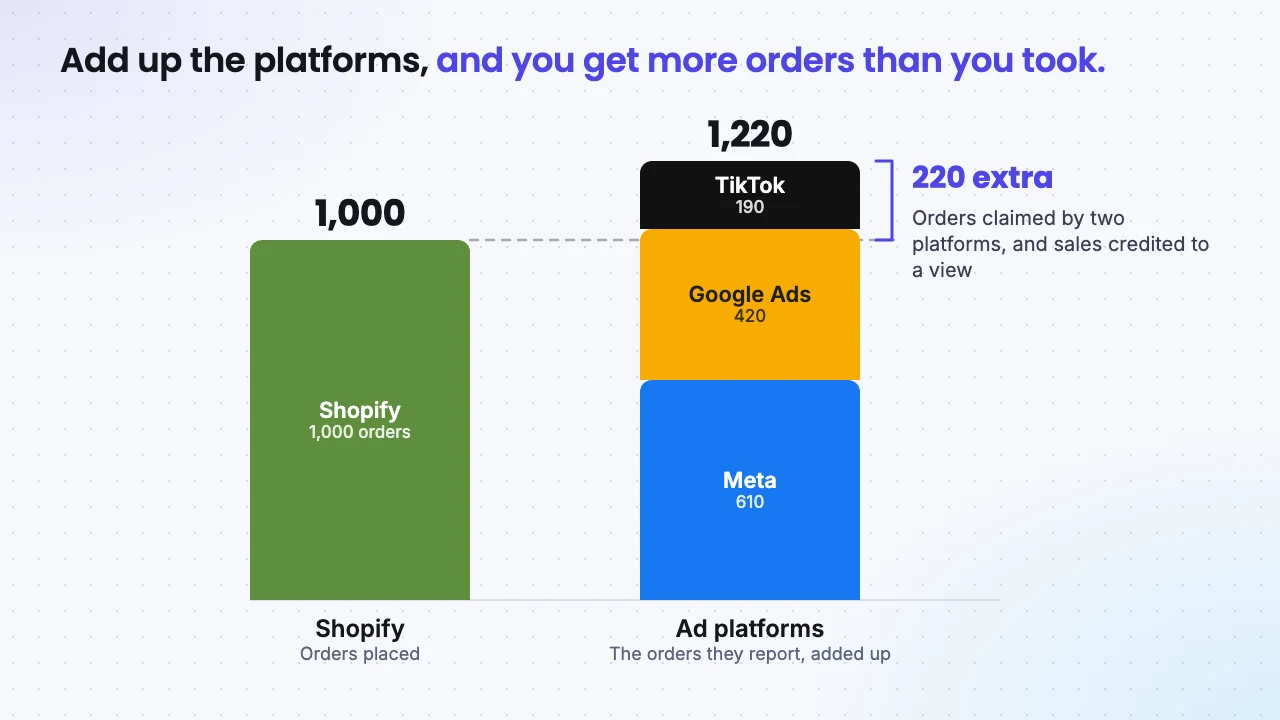
Shopify has a model built for this check. On the Attribution page, the Any click model gives full credit to every channel a buyer clicked, so it double counts on purpose, the way ad platforms do. Shopify suggests using it to reconcile with each platform. Compare Meta Ads Manager with the Meta line under Any click, not with the total.
4. The same order lands on different days
Google Ads files a sale under the day of the click, not the day of the order. A shopper who clicks on Black Friday and buys on Cyber Monday counts on Friday in Google Ads and on Monday in Shopify. It also means last week's Google Ads numbers keep growing for days as late orders come in. To line up with Shopify's dates, add the Conversions (by conv. time) column, which uses the day of the sale.
Meta changed its rule in June 2025. Purchases on your website now appear on the day they happen, while actions inside Meta, such as link clicks, stay on the day the ad was shown.
5. Each report runs on its own clock
Meta reports in the time zone you picked when you created the ad account, and changing it later means Meta closes that account and opens a new one. Shopify reports in your store's time zone. Say your store runs on New York time and your Meta account on Los Angeles time. An order at 1:30 AM on Saturday, November 28 in New York is 10:30 PM on Black Friday in Los Angeles. Meta counts it on Black Friday, Shopify on the day after. Over a whole week this evens out. Over a single day, during the busiest days of the year, it does not.
6. Some conversions are estimates
When platforms cannot see a person, they estimate. Meta models part of the sales from iPhone users who declined tracking, and labels those results as modeled. Google models sales from visitors who decline cookies on your consent banner, and those estimates appear in the Conversions column next to measured ones.
The share of people the platforms cannot follow is large. The measurement company Adjust found that 38% of iPhone users agreed to tracking in early 2026, and only 34% in shopping apps. An estimate can be right on average, but you will never find it as an order in Shopify.
7. Tracking misses some orders and counts others twice
Orders go missing from ad platforms and GA4 when:
- An ad blocker or a privacy setting stops the tag. GA4 needs scripts and cookies to run.
- A consent banner blocks it. In the EEA and the UK, with a consent banner on, Shopify only sends data to pixels after the visitor agrees, and a banner app that does not sync with Shopify's privacy settings can stop pixels from firing at all.
- The Thank you page fails to load. Shopify sends the purchase event once, when the Thank you page or the first upsell page loads.
- Safari forgets the visitor. Cookies set by scripts are deleted after 7 days without a visit, or after 24 hours when the visitor arrived from a link with a click ID. Apple Mail, Messages and Safari Private Browsing also remove tracking parameters that identify a person from links.
- The order never touched the online store. Sales taken in person with Shopify POS never pass through a browser pixel.
Orders get counted twice when the Meta pixel and the Conversions API both send the same purchase without a shared event ID. Meta treats two purchase events as one only when the event name matches and the ID matches within 48 hours. Shopify's Facebook and Instagram app has three data sharing levels: Standard sends pixel events only, while Enhanced and Maximum add the Conversions API, which sends purchases from Shopify's servers and keeps working when a browser blocks the pixel.
8. They disagree on what a purchase is
Shopify lowers your sales when you refund or cancel an order. An ad platform keeps the purchase event it received at checkout. Test orders, edited orders and payment pages add more noise: GA4 can hand the sale to PayPal or another payment page as a referral, unless you add those sites under List unwanted referrals. Place one test order and check what value each platform received, because some setups send tax and shipping and some do not.
A normal gap or broken tracking?
The size of the gap tells you little. Its stability tells you a lot. Each week, take the orders a platform reports and compare them with your Shopify orders for the same days, written as orders per 100 Shopify orders.
Say Meta reports 61, 59 and 62 orders for every 100 Shopify orders three weeks in a row (made up numbers). In week 4, after a theme update, it reports 118. In week 5, after the fix, it is back to 60.
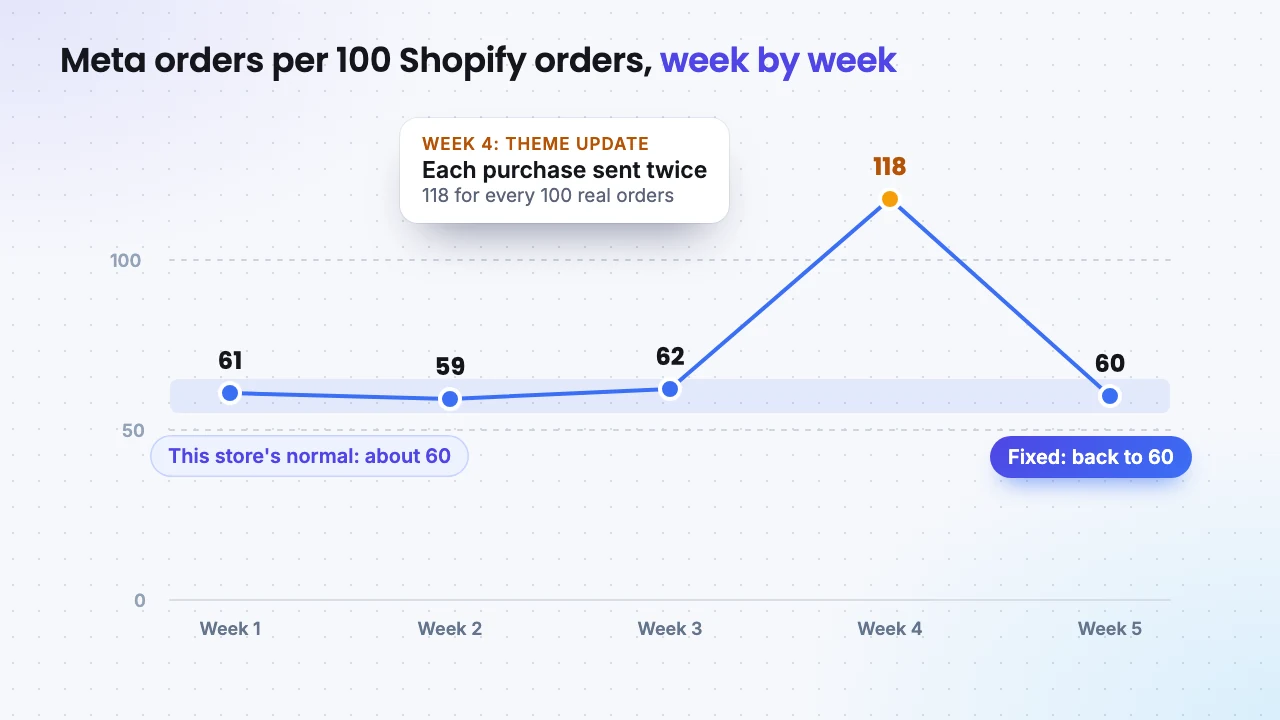
A steady 60 is normal for this store. A jump to 118 in a week when nothing changed in the ads means each purchase was sent twice. A drop to 20 would point the other way, to a pixel that stopped firing.
Before you blame tracking, rule out changes you made yourself. A new window, more retargeting, a campaign that leans on views, or a big email push can all move the ratio for real reasons.
A 20 minute check before you move budget
- Pick the same 7 days everywhere, ending at least 3 days ago. Google Ads fills in late sales, and Shopify can take up to 24 hours to sync ad spend from your marketing apps.
- Use full days in each report's own time zone, or compare whole weeks if the time zones differ.
- Read every platform on the same rule. In Meta, look at 7 days after a link click without views. In Google Ads, add the Conversions (by conv. time) column.
- Compare each platform with its own line in Shopify, under the Any click model on the Attribution page, in the Performance view.
- Write down the ratio and compare it with last week, not with an ideal number.
- If it jumped, place a test order and watch it arrive. In Meta Events Manager, check that browser and server purchase events are being deduplicated. Check that your consent banner app syncs with Shopify, and ask what changed in the theme or checkout apps that week.
When a big channel is in doubt, test it
Every report above shows which ads came before a sale, not which ads caused it. A lift test answers the second question. You hold the ads back from a random group of people, or from a few regions, and compare sales with the group that saw them. Meta itself calls lift experiments like its Conversion Lift the gold standard of measurement. Google Ads offers Conversion Lift studies too, and its entry point for a study dropped to a $5,000 budget in late 2025.
On a smaller budget, run a regional test. Pause one channel in a few states or regions for two to four weeks and compare their sales with similar regions where it kept running. Do it in January, not in the middle of the sale.
Tests also show that a platform's own number is not always too high. Haus, a company that runs these tests, looked at 640 Meta tests by large brands and found that Meta's 7 day click results understated its real effect on direct to consumer sales by 15% on average. So when the platforms add up to more than your orders, look first at overlap and view credit, not only at each platform's click results.
In a shopping app, a referee decides
If you also sell through a mobile app, the same disagreement plays out over installs. Meta, Google and X work as self reporting networks: they decide on their own which installs their ads drove, then tell your mobile measurement partner (MMP), such as AppsFlyer or Adjust. The MMP applies one rule to every network, usually the last tap, so each install goes to one source only.
AppsFlyer lists the usual reasons its numbers differ from Meta's:
- Overlap: Meta claims an install after its ad even if the person also tapped another network's ad. AppsFlyer gives it to the last tap.
- Devices: Meta counts a tap on one phone and an install on another. AppsFlyer needs both on the same device.
- Clocks: Meta reports in Pacific time, AppsFlyer in UTC.
- Windows: The click window set in AppsFlyer can differ from Meta's 7 days.
- Reinstalls: Inside AppsFlyer's reattribution window, a reinstall counts as retargeting, while Meta can still show it as a new install.
The rule from the web side holds here too. Watch the ratio between Meta and the MMP, and look into it when it moves.
What only a survey app sees
Every number above comes from clicks, views or devices. None of them sees the friend who recommended you at dinner, the creator who mentioned you without a link, or the answer ChatGPT gave. Those buyers type your address or search your name, and the reports hand the sale to Direct or Google search.
The only way to see them is to ask, and that is the job of a post purchase survey app.
Put the share of buyers who name each channel next to Shopify's attribution for the same weeks. If Shopify gives Direct a quarter of your BFCM orders while buyers keep naming a creator, the creator started those sales and the reports gave them to someone else. Read how to put the two reports side by side for a worked example.
SEA Survey is a post purchase survey app for Shopify. It adds this question to the Thank you page and saves each response on its order, next to its revenue. AI groups the written Other responses into topics, so a channel you never listed still shows up. On the Growth plan, the Marketing attribution dashboard shows revenue, LTV and repeat rate by the channel buyers named, as a third column next to Shopify and your ad accounts. For the models behind all of this, start with what marketing attribution is.

SEA Survey
Listed as SEA Post Purchase Survey Quiz, 4.9 stars from 188 reviews, with the Built for Shopify badge.
30% off any paid plan for 3 monthsStarter $13.30 instead of $19, Growth $34.30 instead of $49
BFCMSEA30Last day: Dec 7
- Why now: Black Friday week is when Meta, Google and Shopify drift furthest apart, and the busier the sale, the more responses you collect. Start before Nov 27, and you have a third column for the week that matters most.
- On the Free plan: 30 responses a month, with attribution, NPS and CSAT surveys.
- What a paid plan adds: Starter counts 500 responses a month. Growth has unlimited responses and the Marketing attribution dashboard, with revenue and LTV by the channel buyers named, plus A/B testing and conditional logic.
- How to claim: Install SEA Survey from the Shopify App Store, open Plans, paste the code and pick Starter or Growth. Both start with a 7 day free trial.
FAQ
Which number should I trust, Meta or Shopify?
Trust Shopify for how many orders you took and what they brought in. Use Meta to compare its own campaigns and ads with each other. To compare Meta with Google or TikTok, use Shopify's attribution and what buyers tell you, because each ad platform grades only its own ads.
How big a gap is normal?
There is no fixed number. It depends on your windows, how much of your spend goes to views and retargeting, and how many platforms you run. A ratio that stays steady from week to week is normal. A sudden jump or drop is not.
Why does Google Ads keep changing last week's numbers?
Google Ads files each sale under the day of the click, so orders placed days later fill in past days. The Conversions (by conv. time) column files sales under the day they happened, which matches Shopify.
Can a survey app replace my ad platform reports?
No. Use it next to them. Ad platforms show which of their own campaigns and ads work better. A post purchase survey app shows which channels buyers say brought them, including the ones that leave no click. Some buyers misremember and not every buyer responds, so read the responses as shares of buyers over several weeks.