In short
- A cohort is a group of customers who share a starting point, such as the month of their first order. Cohort analysis follows each group over time.
- A store average mixes old buyers with new ones, so it can stay flat while every new group comes back less. A cohort table gives each group its own row.
- Read a cohort table across a row to follow one group, and down a column to compare groups at the same age.
- Black Friday buyers are a cohort of their own. Judge them against last year's November buyers at 60 and 90 days, not against October.
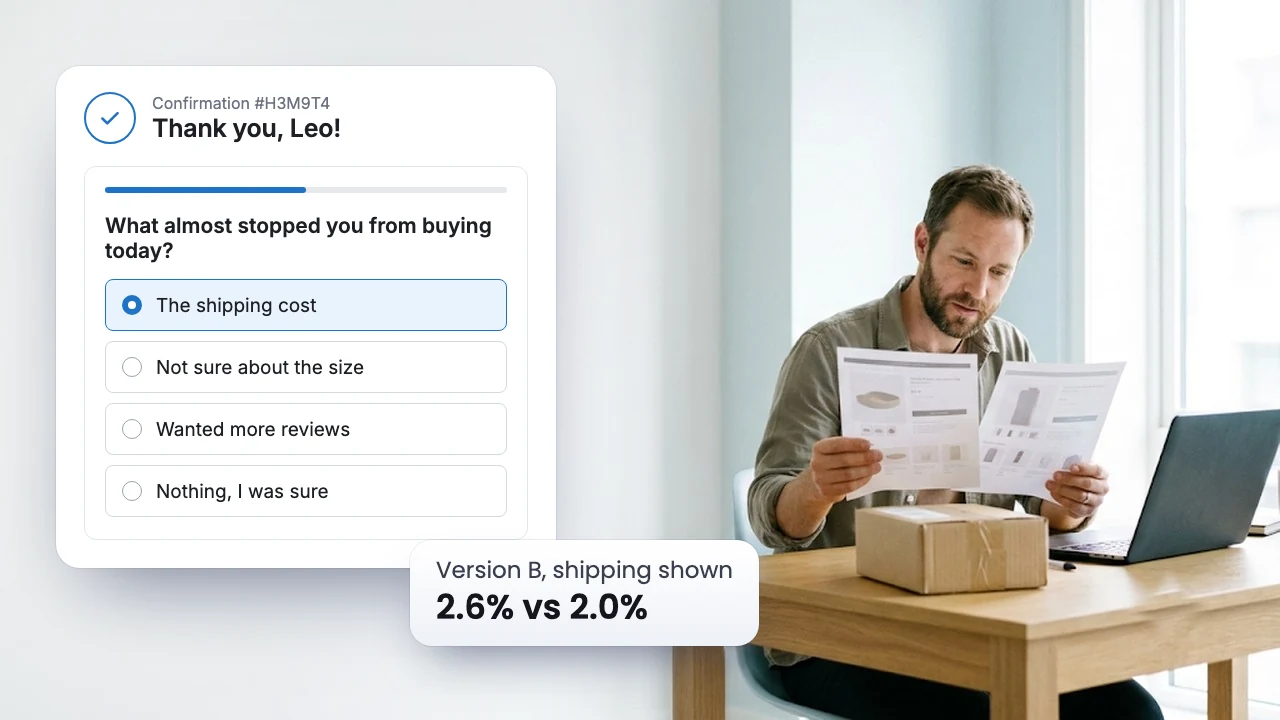
- Clicks can group buyers by the ad or link they tapped. A post purchase survey app groups them by what they say brought them, including the friend, the podcast and the AI chat that left no click.
An average hides who comes back
Take a store whose repeat rate, the share of customers with more than one order, reads 22% in March and 22% again in September (made up numbers). It looks steady.
Now split the same customers by the month of their first order. Spring buyers, most of them from Google search and friends, ordered again at 28%. Summer buyers, most of them from a big TikTok push, ordered again at 15%. The average held because older, loyal buyers kept it up, while each new group came back less than the one before.
That is the job of cohort analysis. It stops new and old customers from hiding each other, so you see the drop the month it starts, not a year later.
What a cohort is
A cohort is a group of customers who share a starting point. The starting point is usually a date, such as the month of the first order. It can also be the first product, the first discount code, or the channel that brought the customer in. Cohort analysis then follows each group from that point: How many order again? How much do they spend? How long do they wait between orders?
The clock is what makes it fair. Each group is measured from its own start, so month 1 of the January buyers sits next to month 1 of the June buyers, even though they happened half a year apart.
Four cohorts answer most questions a Shopify store has:
| Cohort | The shared starting point | The question it answers |
|---|---|---|
| First order month | The month of the first order | Are newer buyers coming back as often as older ones? |
| First product | The product in the first order | Which first product leads to a second order? |
| First offer | The discount code on the first order, or none | Do discount buyers come back at full price? |
| What brought them | The channel the buyer came from | Which channel brings buyers who stay? |
How to read a cohort table
A cohort table puts one group on each row and the months since its first order in the columns. Each cell answers one question. For example, of the customers who first ordered in June, what share had ordered again by month 3? Newer groups have fewer filled cells because they have not been customers for as long, which is why the table looks like a staircase.
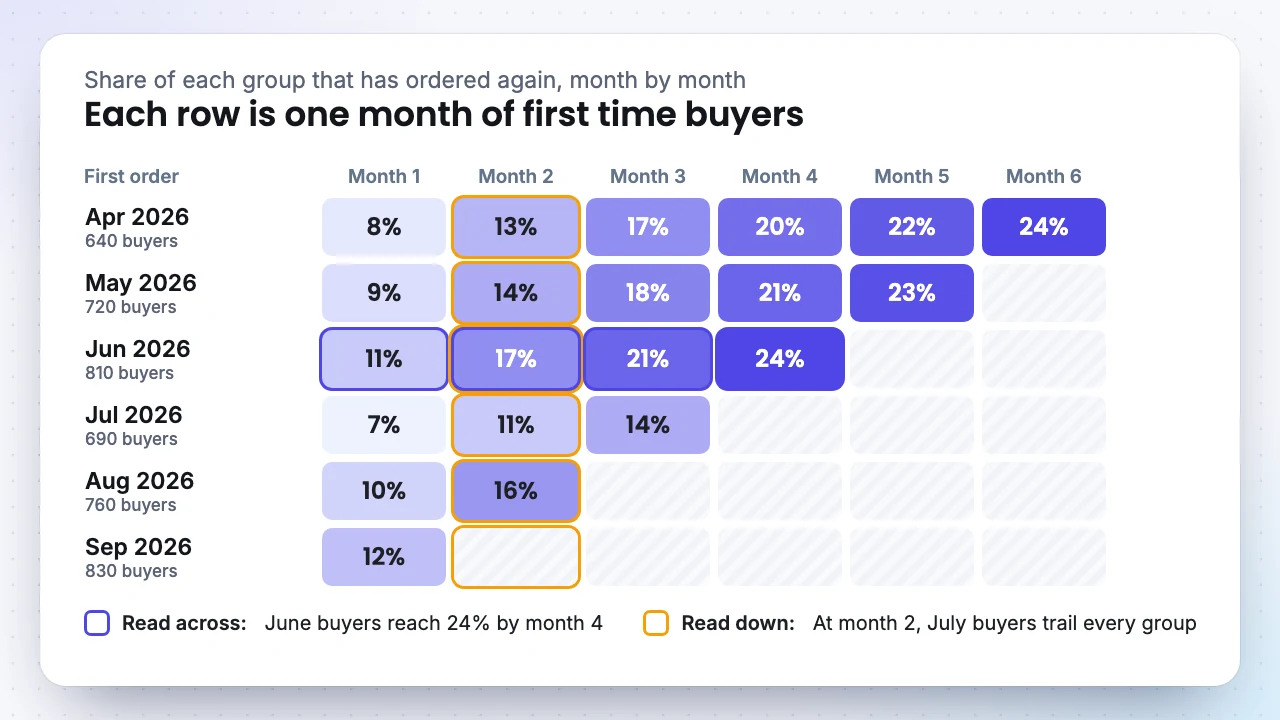
There are three ways to read it:
- Across a row: One group over time. A row that keeps climbing means buyers keep coming back months later. A row that stops growing after month 1 means the second order comes soon or not at all.
- Down a column: Every group at the same age. If month 2 drops for July buyers, something about July was different, such as a channel, a product, a discount or a shipping delay.
- Along a diagonal: One calendar month. If cells in every row light up in the same month, such as everyone's December, the season or a sale did it, not the groups.
Most cohort tables show one of two numbers. The first is the share of each group that has ordered again, also called retention. The second is revenue per customer, which can be shown per month (what each customer spent in that month only) or cumulative (everything spent up to that month). Cumulative revenue per customer is the one to hold up against what a new customer cost you.
Where to find cohorts for a Shopify store
You already have two cohort reports, and a spreadsheet can build the rest.
Shopify. In the admin, go to Analytics, then Reports, and open Customer cohort analysis. Each row is a group of customers whose first order fell in the same week, month or quarter. You choose the number in the cells, from number of customers, customer retention rate, gross sales, net sales and average order value to amount spent per customer, which adds up month after month. Retention rate here means the share of a group who placed an order in that period. Filters on the first order, such as its product, turn the same table into a first product cohort, and a toggle switches the table to a retention curve. The report comes with every plan from Basic up.
GA4. Under Explore, start a Cohort exploration. It groups people by their first visit or by an event such as a first purchase, then counts how many come back, by day, week or month. Standard counts each period on its own and Cumulative adds them up. GA4 follows browsers and devices, not Shopify customers, so one buyer on a phone and a laptop can count twice. Use it for questions about visits, such as whether people who first came from TikTok return to the site.
A spreadsheet. For cohorts neither report builds, such as first discount code:
- Export your orders from the Orders page of the Shopify admin, with the customer's email, the date, the discount code, the total and any refund.
- For each customer, find the month of their first order. That month is their cohort.
- For each order, count the months since that customer's first order.
- In a pivot table, put cohorts in the rows, months since the first order in the columns, and count the customers who ordered.
Your Black Friday buyers are a cohort of their own
People who first buy from you on Black Friday or Cyber Monday arrive with a deal in hand. Many buy a gift, and some will not need your product again until next season. Shopify's own guide says most customers acquired during BFCM have a lower lifetime value. An analysis of 106 Shopify stores by the segmentation app Tresl put a number on it. New buyers from BFCM 2024 ordered again at 14% within six months, against 19% for new buyers from the rest of the year.
So your November group will likely look weak next to your October buyers, and that alone says little.
Three rules keep the comparison fair:
- Compare with last year's November buyers, not this October's. Same season, same mix of deal hunters and gift buyers.
- Judge them at 60 and 90 days, then again at 12 months. A gift buyer who comes back next November is still a good customer.
- Split the cohort by first offer. Buyers who used a Black Friday code and buyers who paid full price in the same week are two groups. If code buyers only return for the next code, they need a different January email than the rest.
Many November buyers also saw you weeks before they bought, in a video, an ad or a friend's post, and came back for the deal. Your click reports often miss that first contact, as attribution windows explained shows. Their answer to a survey does not.
Group buyers by what brought them
The most useful cohort for a marketing team is the channel cohort, where buyers are grouped by what brought them in and followed over time. It tells you which channel brings buyers who order again, not only buyers who order once.
Clicks can build part of it. UTM tags, the short labels at the end of a link, tell you which ad or email a buyer tapped. But a buyer who heard about you from a friend, a podcast or an AI chat arrives by typing your name. In click data they land in direct or search, which says nothing about why they came.
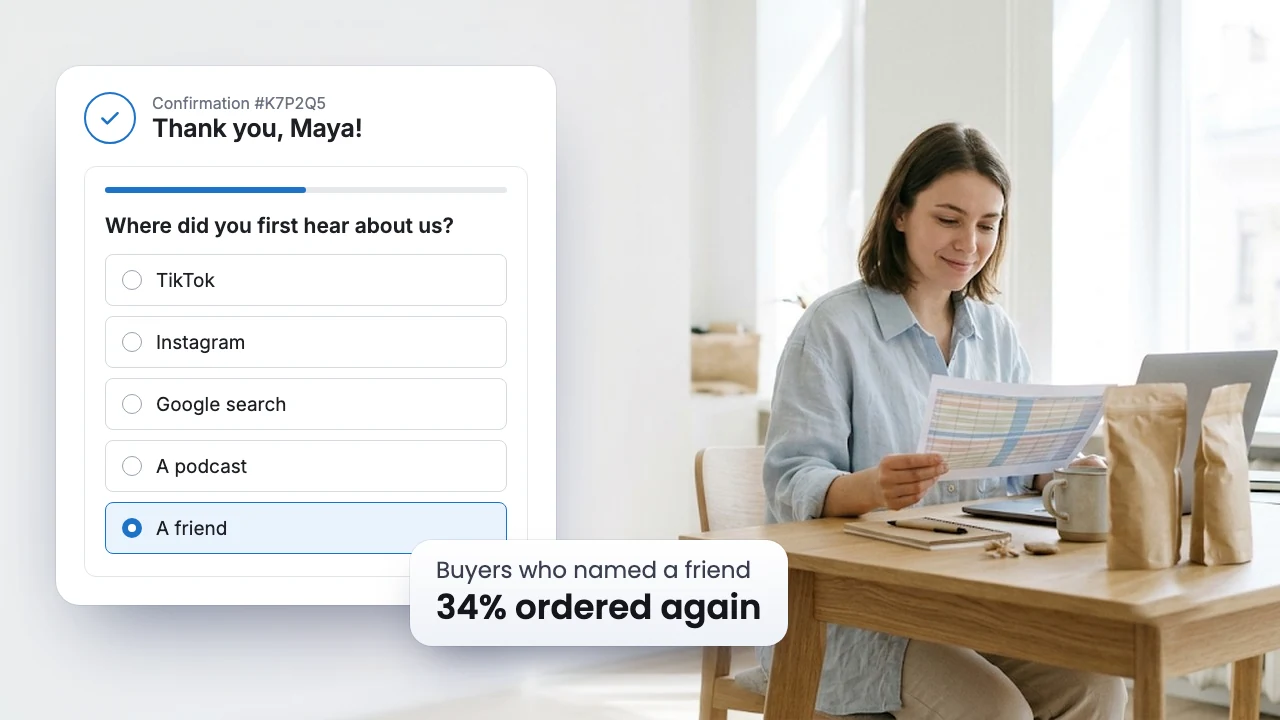
A post purchase survey app fills that gap. Ask on the Thank you page:
Each response becomes the buyer's cohort label. Follow those groups for a few months and the gaps are often wider than between first order months.
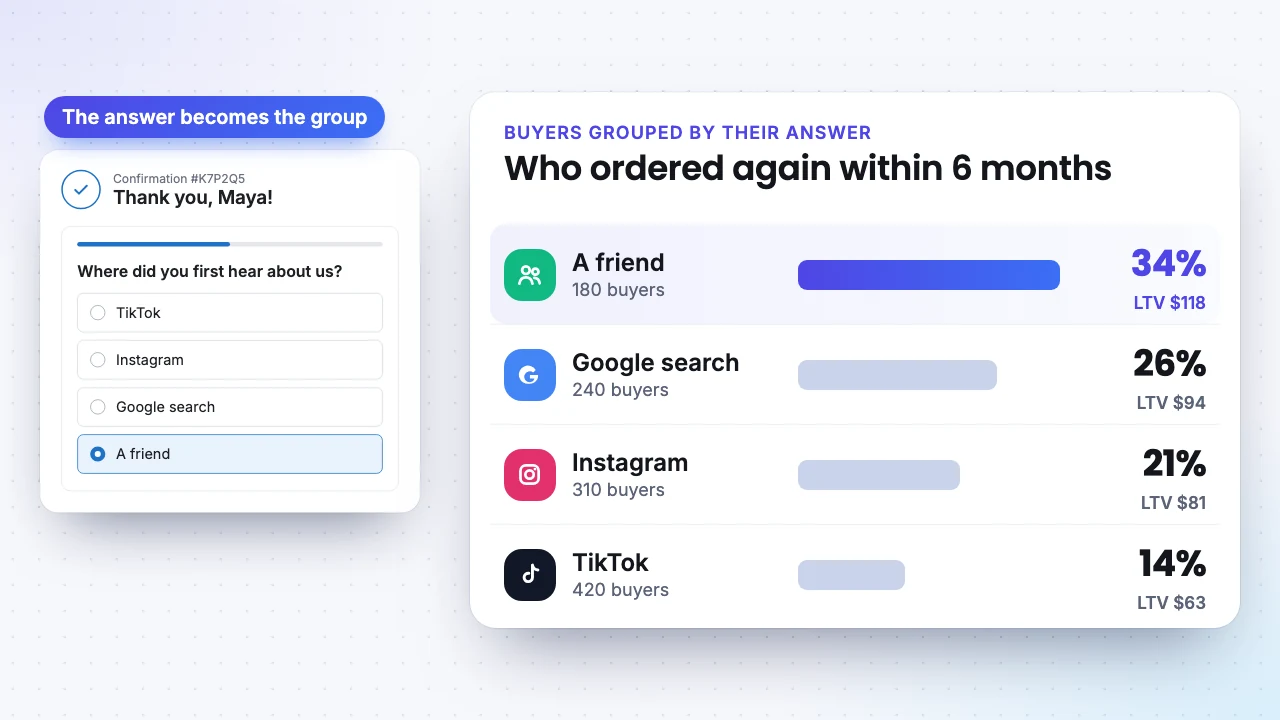
A gap like this changes the plan. A channel with cheap first orders and few second orders needs a strong welcome flow before you spend more on it. A channel whose buyers come back on their own is worth growing, for example with a referral offer. To learn what made people return, show a second question only to returning customers through a customer segment: "What brought you back today?"
SEA Survey is a post purchase survey app for Shopify. It asks the question on the Thank you page, in a post purchase email or on your store, and saves each response on its order. On the Growth plan, Marketing attribution turns the responses into channel cohorts. For each channel buyers named, it shows customers, orders, revenue, first and lifetime AOV, LTV, repeat rate and time between orders. Its Cohort LTV heatmap gives each month of new buyers a row and follows revenue per customer for 12 months, per month or cumulative, for every channel or one at a time, and it flags groups too small to trust. It counts the orders linked to a survey response, so read it next to Shopify's own report. The Marketing attribution guide shows the setup.

SEA Survey
Listed as SEA Post Purchase Survey Quiz, 4.9 stars from 188 reviews, with the Built for Shopify badge.
30% off any paid plan for 3 monthsStarter $13.30 instead of $19, Growth $34.30 instead of $49
BFCMSEA30Last day: Dec 7
- Why now: A response labels each buyer from the first order. Start before Nov 27, and every Black Friday buyer carries a channel into the cohorts you read in January and February.
- On the Free plan: 30 responses a month, with attribution, NPS and CSAT surveys.
- What a paid plan adds: Starter counts 500 responses a month. Growth has unlimited responses and the Marketing attribution dashboard, with LTV, repeat rate and the Cohort LTV heatmap by the channel buyers named, plus A/B testing and conditional logic.
- How to claim: Install SEA Survey from the Shopify App Store, open Plans, paste the code and pick Starter or Growth. Both start with a 7 day free trial.
Five ways a cohort table misleads
- The groups are too small. In a group of 40 buyers, one person is 2.5 points. Merge months into quarters until each group has a few hundred buyers, or read the direction, not the exact number.
- A young group sits next to an old one. Compare cells of the same age. A two month old group's total will always trail a year old group's total.
- Refunds stay in. A month with many returns looks better than it was. Use net sales and leave cancelled orders out.
- A season passes for a trend. If every row jumps in the same calendar month, the calendar did it.
- One person counts as two. A buyer who checks out with two email addresses becomes two customers with one order each, so repeat rates read a little low. Compare groups with each other, and the error mostly cancels out.
What to set up before Black Friday
- Open your cohort report and write down last November's group at months 1, 2 and 3. That is the line this year's Black Friday buyers have to clear.
- Check that your sale codes show on orders, so you can split the November group into code buyers and full price buyers later.
- Find your usual time between the first and second order, and time the first email after the sale to land a little before it.
- Install a post purchase survey app and add "Where did you first hear about us?" to the Thank you page, so every Black Friday buyer gets a channel from the first order. SEA Survey has a Free plan, and code
BFCMSEA30takes 30% off any paid plan for 3 months, until Dec 7. - Put two dates in your calendar, late January and late February, to read the November group at 60 and 90 days.
FAQ
What is cohort analysis in simple terms?
You put customers into groups by a shared start, such as the month they first bought, and follow each group month by month. It shows whether newer customers behave better or worse than older ones, which a single store average hides.
What is the difference between a cohort and a segment?
A segment groups customers by who they are today, such as everyone who spent over $200. A cohort groups them by a shared start and follows them through time. A cohort can be split into segments, and a segment can be read as cohorts.
How many customers does a cohort need?
A few hundred keeps the percentages steady. Under 100, one or two orders move the number by several points, so read the direction rather than the exact figure, or merge months into quarters.
What is a good repeat purchase rate for a Shopify store?
It depends on what you sell and how often people need it. Coffee and supplements are bought again within weeks, furniture within years. Compare your own cohorts with each other and with the same season last year, not with another store's average.
Do I need a survey app if Shopify already has a cohort report?
They answer different questions. Shopify groups customers by when they first bought. A post purchase survey app groups them by what they say brought them, including the friend or the podcast that left no click. Read the two side by side.