In short
- An A/B test splits shoppers at random between version A, what you have now, and version B, with one change. Then it compares one number you picked before the start.
- Traffic decides what you can test. At 1,000 visits a day and a 2% conversion rate, a 30% lift takes about 3 weeks to confirm, and a 10% lift takes over 5 months.
- Decide the end date before you start, run whole weeks, and do not stop early because B looks ahead.
- Black Friday shoppers are not your usual shoppers. Finish store tests before the sale, and test emails and ads during it.
- A test tells you which version won, not why. A post purchase survey app tells you what almost stopped buyers, which is where good tests come from.
What an A/B test is
An A/B test shows two versions of one thing to two groups of shoppers at the same time. The groups are chosen at random, so they are alike in every way except the version they see. Whatever moves differently between them, your change caused it.
Say your product page shows the price, and shipping costs only appear at checkout. Version B adds one line under the price: "Free shipping over $50, else $6." Half of your visitors see A, half see B, and after enough visits you compare how many of each half placed an order.
Why not change the page on Monday and compare this week with last week? Because sales move with everything else too, such as an email send, a creator's post, payday or the weather. A random split runs both versions in the same week, with the same ads and the same email, so your change is the one difference left.
A few words you will meet:
- Control: Version A, the page or email as it is today.
- Variant: Version B, with the one change you want to test.
- Conversion rate: The share of visits that end in an order. A 2% conversion rate means 2 orders per 100 visits.
- Lift: How much better B does than A. Going from 2.0% to 2.6% is a 30% lift.
- Significance: How unlikely the gap would be if the change did nothing. Most tools use 95% confidence as the bar.
A multivariate test changes several things at once, such as the headline, the image and the button, and tests every combination. It needs many times the traffic of an A/B test, so most Shopify stores are better off with A/B.
How much traffic a test needs
This is the part most guides skip, and where most store tests go wrong. The smaller the difference you want to detect, the more visits you need before the result means anything.
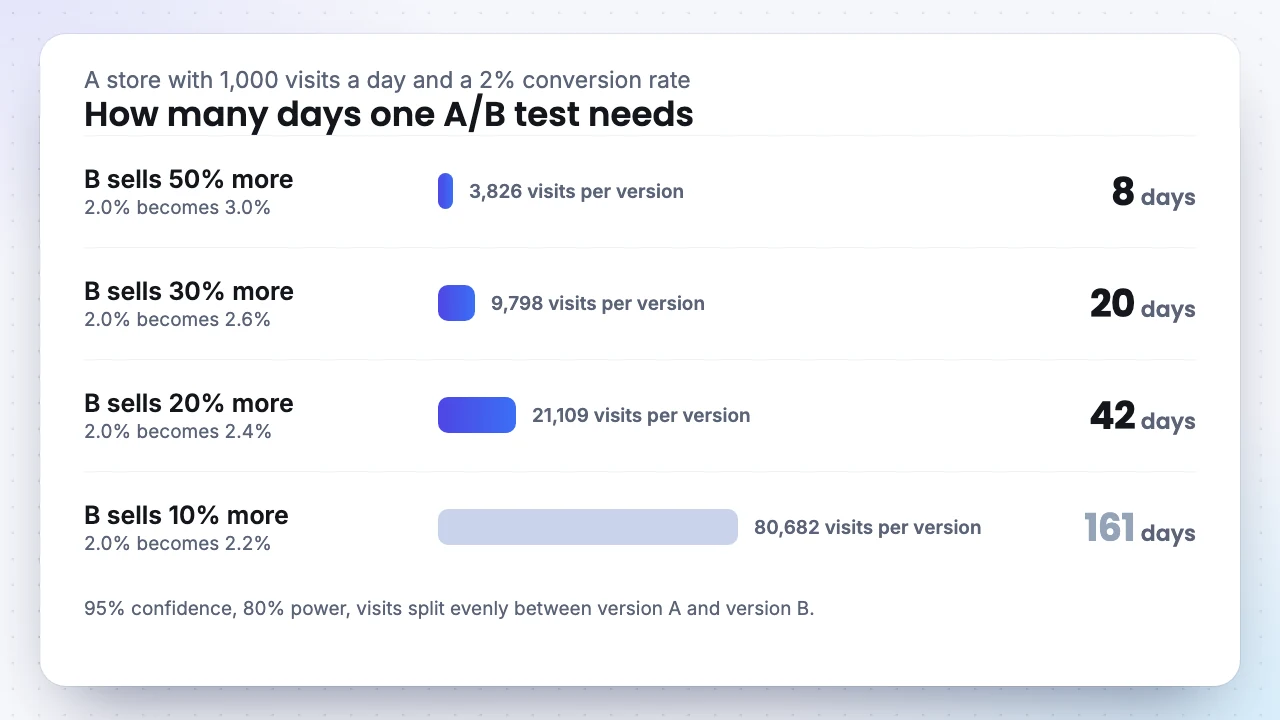
The numbers come from the standard sample size formula, at 95% confidence and 80% power, the defaults in most free calculators. Power is the chance the test spots a real lift of that size. Run your own numbers before every test. Put in your conversion rate and the smallest lift worth acting on, and the calculator tells you how many visits each version needs. Divide by your daily visits and you have the end date.
If that date is months away, there are better options than a test that never finishes:
- Test bigger changes. A new free shipping threshold or a rebuilt product page can move sales by 20% or more. A new button color rarely does.
- Test where the traffic is. Your best selling product page or your home page, not a page with 50 visits a day.
- Test a number that moves more often. Add to cart rate is higher than conversion rate, so it needs fewer visits. Check orders before you roll out, because more carts do not always mean more sales.
- Test in email and ads. Each campaign send splits a large list at once, so you get an answer in hours or days.
- Ask instead. When traffic is too low for a test, a question on the Thank you page tells you what to fix first.
Start from a reason, not a guess
A test is only as good as the idea behind it. Ideas from a meeting ("let's try a bigger button") often lose, because nobody knows what is holding shoppers back. Ideas from shoppers win more often, because they target a real doubt.
Write each idea down before the test starts, in one sentence:
Because [what shoppers told us or did], we think [the change] will raise [one number] for [which shoppers].
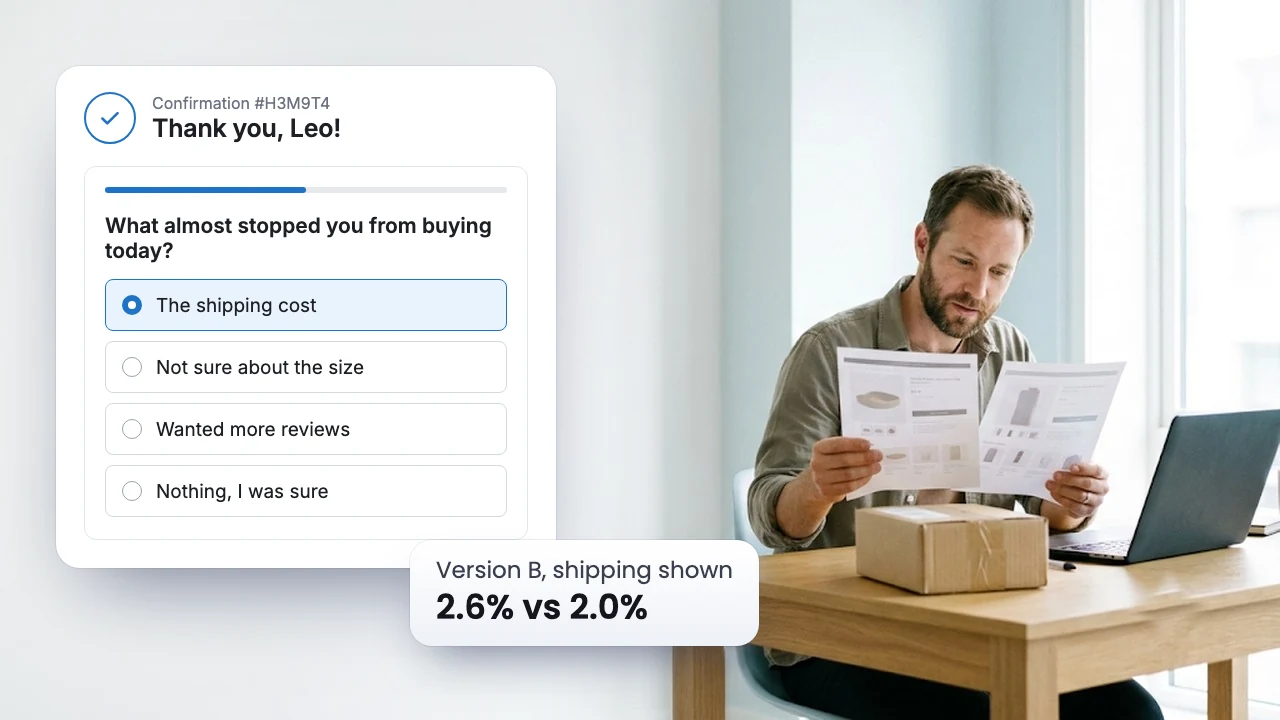
The best place to find the "because" is your buyers. Ask on the Thank you page, in a post purchase survey app:
Buyers are the shoppers who got past their doubt, so they remember it. If a third of them name the shipping cost, many of the shoppers who left over it never reached checkout at all.
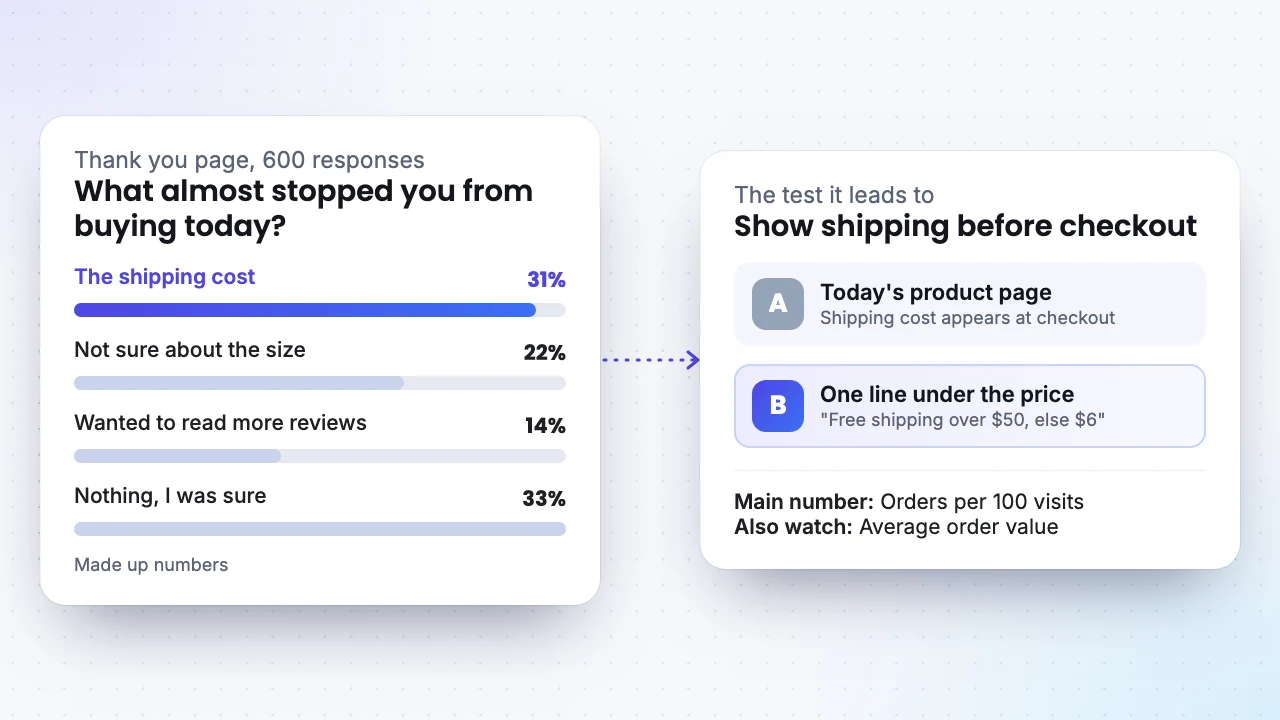
The sentence for this test reads: "Because 31% of buyers said the shipping cost almost stopped them, we think a shipping line under the price will raise orders per 100 visits on product pages." Writing it first matters. Once results come in, it is tempting to tell a new story that fits whatever happened.
Other good sources of reasons are support chats ("Do you ship to Canada?"), reviews, and session recordings that show where shoppers stop scrolling.
Then pick your numbers:
- One main number, decided before the start. For a product page, orders per 100 visits or revenue per visit.
- Two or three guard numbers, which must not get worse, such as average order value, refund rate, or unsubscribes for an email.
How to run a fair test
- Set the size and the end date first. Use a sample size calculator, then write the date down.
- Run whole weeks. Weekend shoppers are not weekday shoppers. Even if the calculator says 10 days, run 14.
- Do not stop when B pulls ahead. Results swing a lot in the first days. Check every day and stop at the first good result, and you will crown winners that are not real. Evan Miller, whose free sample size calculator many teams use, showed that peeking at a test ten times turns a 1% false alarm rate into 5%.
- Change nothing during the test. No price change, no new banner on one version, no switch in traffic share. If you must change something, start again.
- Check the split. A 50/50 test that ends up 55/45 has a problem, such as a redirect or a cached page. Fix it before you trust the result.
- Run one test per page at a time. Two tests on the same page blur into each other.
How to read the result
Know what 95% confidence means. If the change did nothing, a gap this large would show up less than 5% of the time. It does not mean B has a 95% chance of being better. The American Statistical Association puts it plainly. A p value does not measure the probability that the data were produced by random chance alone.
Look at the range, not only the lift. A result like "B: +18%, likely between +2% and +34%" says B is probably better and that the size is uncertain. Plan around the low end.
Check the guard numbers. A pop up that lifts email signups can lower orders. A free shipping line that lifts orders can lower average order value. A win on the main number with a loss on a guard number needs a second look before rollout.
Slice only where you planned to. Pick one or two splits before the test, such as mobile and desktop. Cut the result into ten groups afterwards and one will show a "winner" by chance.
Watch for novelty. A new look can draw clicks for a week from returning visitors who are only curious. Check the main number again a month after rollout.
No winner is still a result. It tells you the change does not matter much to shoppers. Keep whichever version is simpler, and go back to your list of reasons.
A/B testing around Black Friday
Over the 2025 BFCM weekend, Shopify merchants sold a record $14.6 billion, 27% more than the year before. That week brings a different crowd, with more first time visitors, deal hunters and gift buyers. A version that wins with them may lose in January. A test that runs from mid November into December mixes two crowds and answers neither.
- Do not start a store test that cannot finish before the sale. If the calculator says 4 weeks and Black Friday is 3 weeks away, keep the idea for January.
- Keep the winner live through Cyber Monday. Peak week is the wrong time to find a broken variant.
- Test emails and ads during the sale. Each send or campaign is its own test, finished within hours or days, before the crowd changes.
- Collect reasons instead. Your busiest week of buyers can fill the January test list. Ask them what almost stopped them.
Tools for A/B testing on Shopify
- Shopify Rollouts. In the admin under Markets, then Rollouts, an Experiment compares a new theme, checkout or accounts setup against your current one, split 50/50 by default. Theme tests report conversion rate, add to cart rate, reached checkout rate and bounce rate. Experiments run on the Grow plan or higher, and count only visitors who gave cookie consent.
- Klaviyo. A campaign A/B test can try subject lines, content or send times on part of your list, pick a winner by open rate, click rate or placed order rate, and send it to the rest. Choose click rate or placed order rate: Apple Mail opens emails on its own, and Klaviyo counts those opens in open rate tests.
- Meta Ads Manager. An A/B test compares ad images, text, audiences or placements, and nobody sees both versions. Meta recommends at least 7 days, and a test can run for up to 30.
- Google Optimize. Google shut it down on September 30, 2023, so skip any guide that sends you there.
Ask buyers why
A test tells you that B sold more. It does not tell you why, and the why decides your next test. A post purchase survey app helps at three points.
Before the test, responses give you the reason, as above.
After the rollout, keep asking the same question. If "the shipping cost" falls from 31% of responses to 12% once B is live for everyone, you fixed the doubt, not only the number. If it stays at 31%, B won for some other reason, and the shipping problem is still open.
On the survey itself, test the question. The wording, the order of the options and the page it appears on all change how many buyers answer. Far more shoppers start a survey than place an order, so a survey test finishes fast. If 25% of buyers start your survey, a 20% lift shows up after about 1,250 views per version, or 2,500 orders in all. A store with 100 orders a day gets there in under a month.
SEA Survey is a post purchase survey app for Shopify. It asks your questions on the Thank you page, in a post purchase email, on your store or when a shopper is about to leave, and saves each response on its order. On the Growth plan, its A/B testing splits shoppers between two surveys at the share you choose, on the channels you pick, and compares start rate, completion rate and dismissal rate. It logs every edit made to either survey while the test runs, so a change in the middle does not pass for a result. The A/B testing guide shows the setup.

SEA Survey
Listed as SEA Post Purchase Survey Quiz, 4.9 stars from 188 reviews, with the Built for Shopify badge.
30% off any paid plan for 3 monthsStarter $13.30 instead of $19, Growth $34.30 instead of $49
BFCMSEA30Last day: Dec 7
- Why now: Black Friday week brings more buyers than any other. Ask them what almost stopped them, and you start January with a test list in their own words.
- On the Free plan: 30 responses a month, with attribution, NPS and CSAT surveys.
- What a paid plan adds: Starter counts 500 responses a month. Growth has unlimited responses, A/B testing for surveys and conditional logic, plus the Marketing attribution dashboard with revenue and LTV by the channel buyers named.
- How to claim: Install SEA Survey from the Shopify App Store, open Plans, paste the code and pick Starter or Growth. Both start with a 7 day free trial.
Your first test, step by step
- Add "What almost stopped you from buying today?" to the Thank you page with a post purchase survey app, and collect two weeks of responses. SEA Survey has a Free plan, and code
BFCMSEA30takes 30% off any paid plan for 3 months, until Dec 7. - Pick the doubt buyers name most and write the one sentence idea.
- Work out the size and the end date. If it is more than 6 weeks away, make the change bolder or test a busier page.
- Build version B with one change, and check it on a phone before it goes live.
- Run it to the end date without peeking for a winner.
- Read the main number, the range and the guard numbers, then roll out or drop.
- Keep asking the question, and check that the doubt you targeted shows up less often.
FAQ
How long should an A/B test run?
Until it reaches the number of visits you worked out before the start, and for at least two full weeks. Stopping early because one version looks ahead is the most common way to pick a false winner.
What does statistical significance mean in an A/B test?
It means the gap between A and B would rarely appear if the change did nothing. At 95% confidence, that is less than 5% of the time. It does not tell you how big the real lift is, so look at the range too.
Can a small Shopify store run A/B tests?
Yes, with bold changes on busy pages, or with emails and ads, where each send reaches many people at once. For small tweaks on a quiet page, asking buyers what held them back teaches you more in the same time.
What is the difference between A/B testing and multivariate testing?
An A/B test compares two versions that differ in one change. A multivariate test changes several things at once and compares every combination, so it needs many times the traffic.
How does a post purchase survey app help with A/B testing?
It gives each test a reason before it starts, by asking buyers what almost stopped them, and it shows after the rollout whether that doubt went away. Some survey apps, SEA Survey included, also A/B test the survey itself, so more buyers answer.