In short
- Marketing analytics is measuring what your marketing does and turning it into decisions about where the next dollar and the next hour go.
- It answers four questions in order. What happened? Why did it happen? What will happen next? What should we do about it?
- A Shopify store already has most of the tools: Shopify Analytics, GA4, the reports in each ad account, and your email tool.
- A short weekly routine with a few numbers beats a dashboard with fifty.
- Every report counts clicks and orders. A post purchase survey app adds what no click shows, such as why buyers came and what almost stopped them.
What marketing analytics is
Marketing analytics is the habit of measuring your marketing, finding out why the numbers moved, and deciding what to change. Most of the data is already yours, from orders, visits, ad clicks and email opens to what customers tell you.
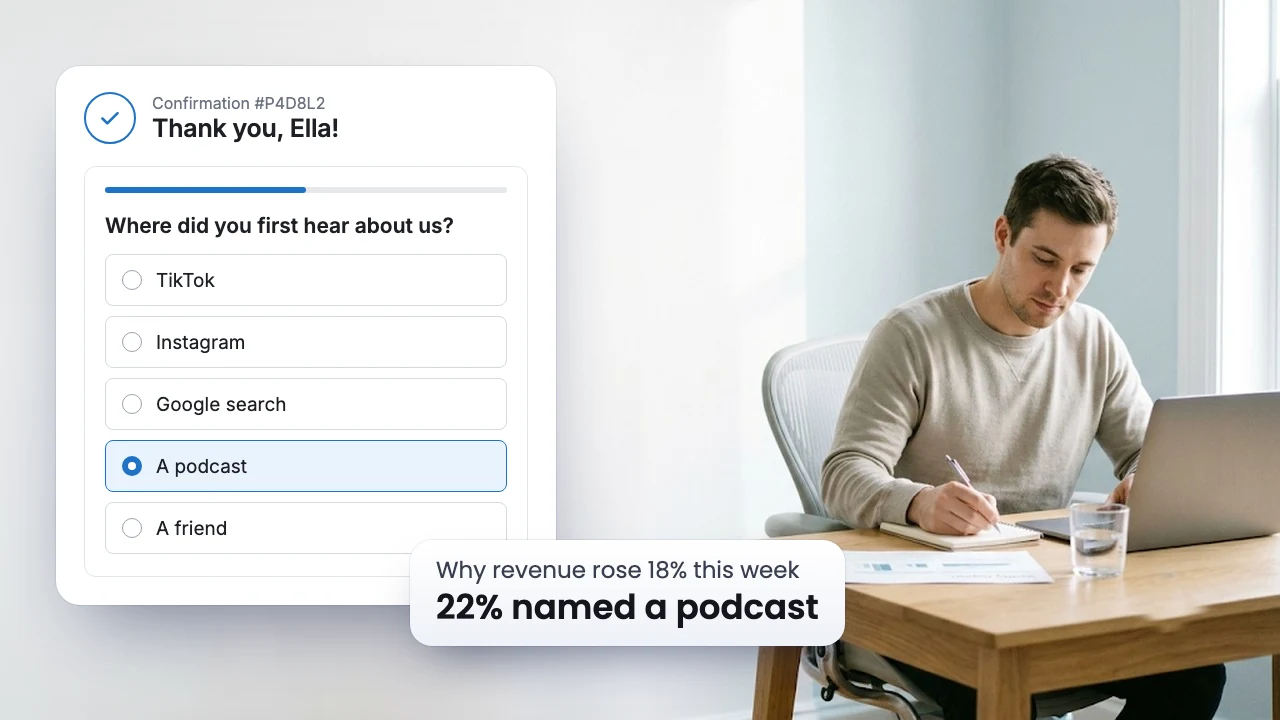
Say your October revenue is up 18% on September (made up numbers). A report tells you that much. Marketing analytics keeps asking. Which channel brought the extra orders? Were they new buyers or regulars? Will they come back? Should the November budget follow them? Each answer leads to a decision, and the decision is the point.
Four questions, one ladder
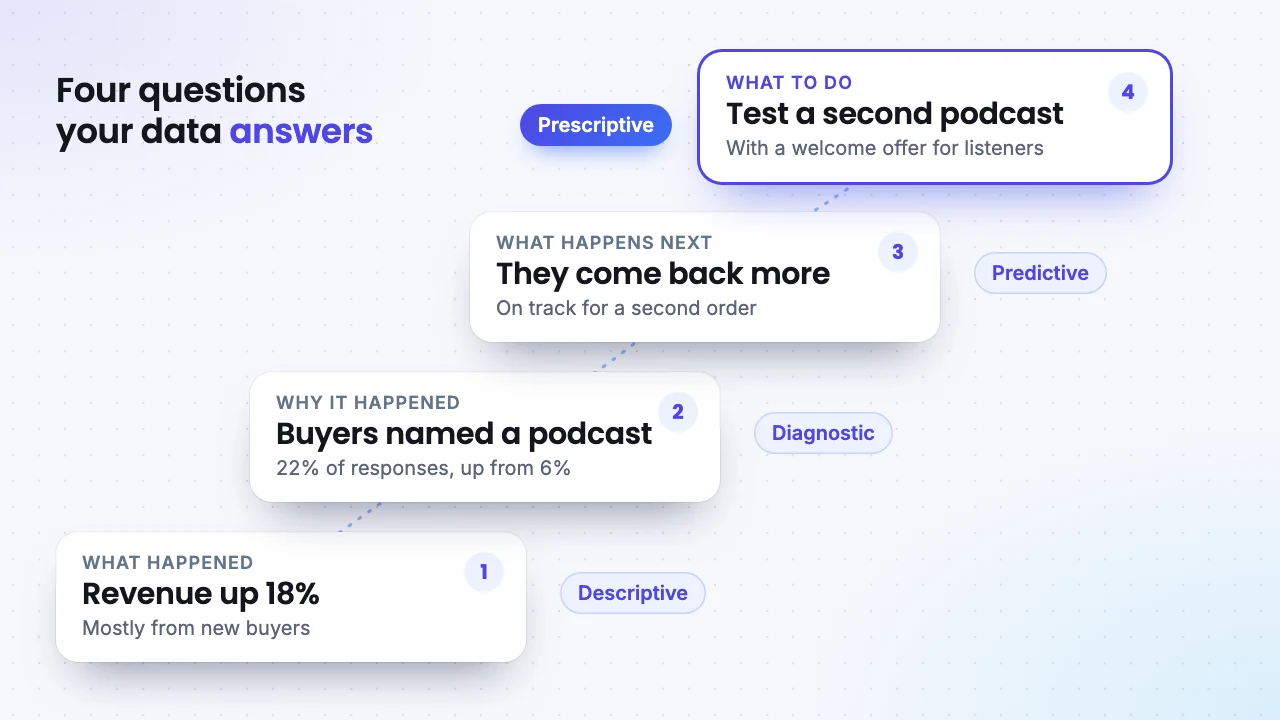
Analysts sort the work into four kinds of analysis. Each one answers a question, and each step needs the one before it.
| The question | The name | A Shopify example | Where to read it |
|---|---|---|---|
| What happened? | Descriptive | Revenue rose 18%, mostly from new buyers | Shopify Analytics, GA4 |
| Why did it happen? | Diagnostic | A podcast mention sent new buyers who searched your name | Attribution reports, cohorts, buyer answers |
| What will happen next? | Predictive | Buyers from the podcast are on track to order again within 60 days | Cohort reports, predicted spend |
| What should we do? | Prescriptive | Book a second podcast and test a welcome offer for its listeners | A/B tests, budget suggestions |
What happened is where every store starts. It covers sales, visits, conversion rate and average order value, by day, channel and product, and Shopify Analytics and GA4 cover it well.
Why it happened is where most stores stop short. The reports say which link was clicked last, not what made someone buy. Attribution, cohorts and buyer answers fill the gap. What is marketing attribution? explains how credit is split between channels, and cohort analysis shows whether new buyers come back as often as older ones.
What will happen next needs history. Shopify's Customer cohort analysis report can project future spend on the Advanced plan and above, once a store has 24 months of sales. Klaviyo can predict each customer's lifetime value and next order date once your store meets its minimums, such as 500 customers with orders and 180 days of order history.
What to do turns the other three into a change you can check. An A/B test tells you whether the change worked before you roll it out to everyone.
The numbers worth reading every week
Most stores need fewer numbers, read more often. These seven cover the questions above:
- Sessions by channel: Visits to your store, split by where they came from.
- Conversion rate: Orders per 100 sessions. Read it by channel and by device.
- Average order value: Revenue divided by orders.
- New customer revenue: Revenue from buyers placing their first order. During BFCM this is the number that tells you if the sale grew the store or only discounted your regulars.
- Returning customer rate: The share of customers who had ordered before. Shopify counts a returning customer as one whose order history already includes at least one order.
- Cost per new customer: Ad spend divided by new customers in the same period. Only you know your spend, so this one lives in your own sheet.
- What buyers said: The share of buyers naming each channel when asked how they found you.
Pick one of them as the number for the season. For Black Friday that is often new customer revenue. For January it is usually returning customer rate.
A 30 minute routine for Monday morning
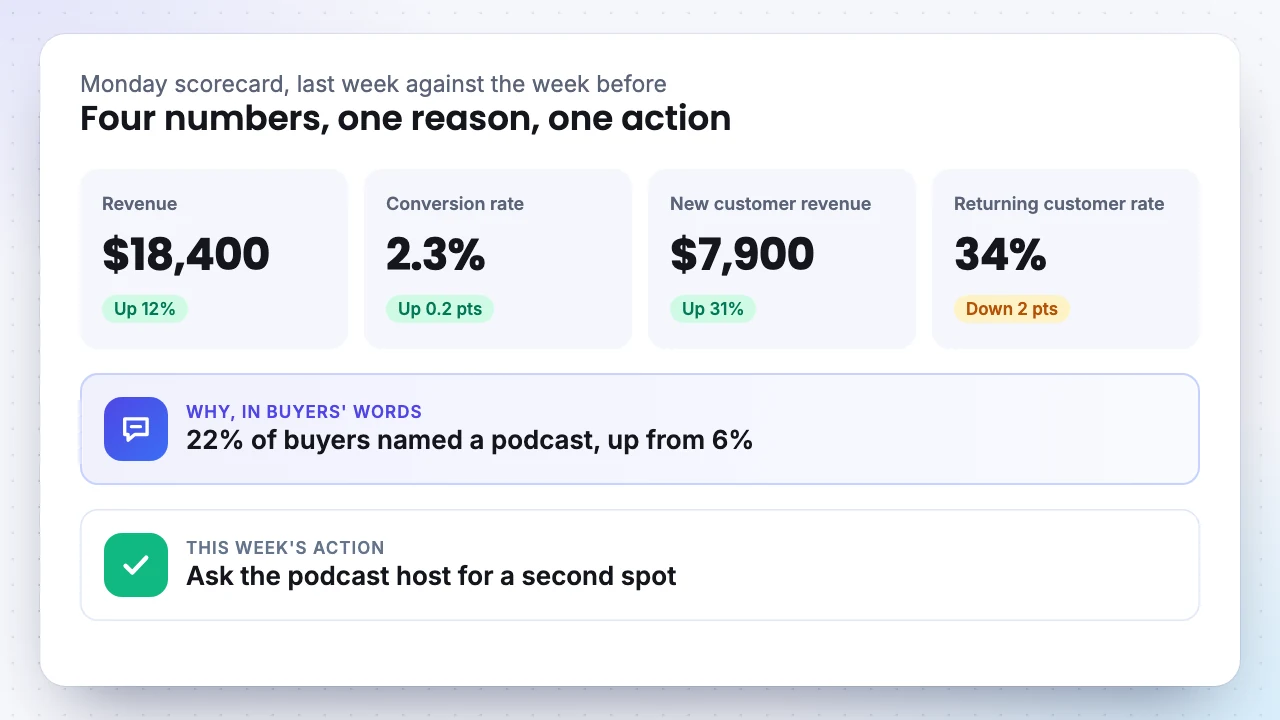
- Look. Open the same report every week and write down the seven numbers next to last week's.
- Pick one move. Choose the biggest jump or drop. Ignore the rest for now.
- Ask why. Check it by channel, by new and returning buyers, and in what buyers said. Many weeks, the cause is a holiday, an email send or a broken tracking tag, so rule those out first. Why Meta, Google and Shopify never show the same orders has a 20 minute check for tracking.
- Decide one action. Write it down with the number you expect it to move.
- Check it next Monday. Then start again.
The routine is what makes the data useful. A dashboard nobody reads changes nothing.
Tools a Shopify store already has
- Shopify Analytics: Sales, sessions, conversion rate and customer reports, including Customer cohort analysis. The attribution view under Growth, then Attribution, shows which marketing visits came before orders.
- GA4: Visits from every channel and the paths people take, with its own attribution rules. Attribution windows explained shows how far back each tool looks.
- Ad accounts: Meta, Google Ads and TikTok each report the orders they think their ads caused, by their own rules.
- Your email tool: Klaviyo and similar tools report revenue from each email and flow, and run A/B tests on subject lines and content.
- A spreadsheet: Where the numbers from every tool meet, along with your ad spend.
Bigger teams hire a marketing analyst for this work, someone who knows marketing, a spreadsheet and SQL, and a dashboard tool such as Looker Studio, Power BI or Tableau. In a smaller store the owner or the one marketer does it, and the weekly routine above is enough to start.
What reports cannot see
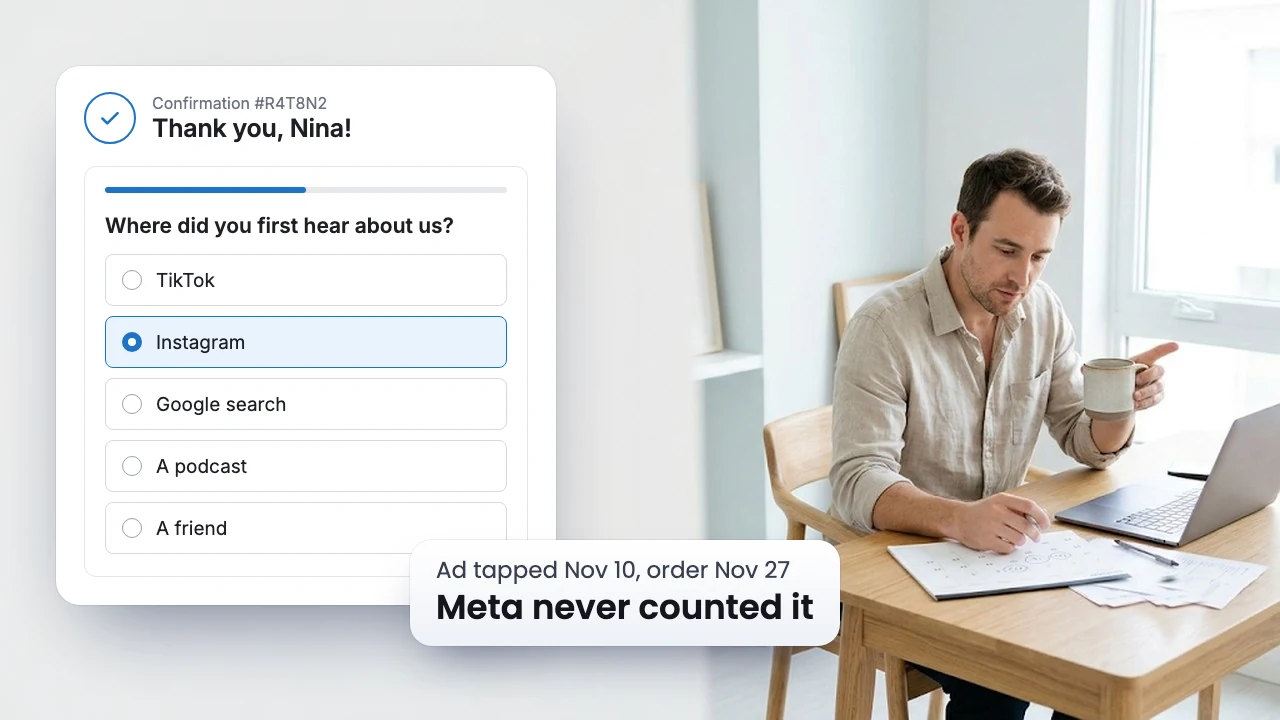
Every tool above counts what happens on a screen, such as a tap, a visit or an order. None of them sees what happened before the first tap. A friend's tip, a podcast, a creator video with no link, an answer from ChatGPT all arrive as a direct visit or a search for your name. And none of them sees the doubt a shopper had before they bought.
Only the buyer knows. A post purchase survey app asks them on the Thank you page, right after the order, while the purchase is fresh:
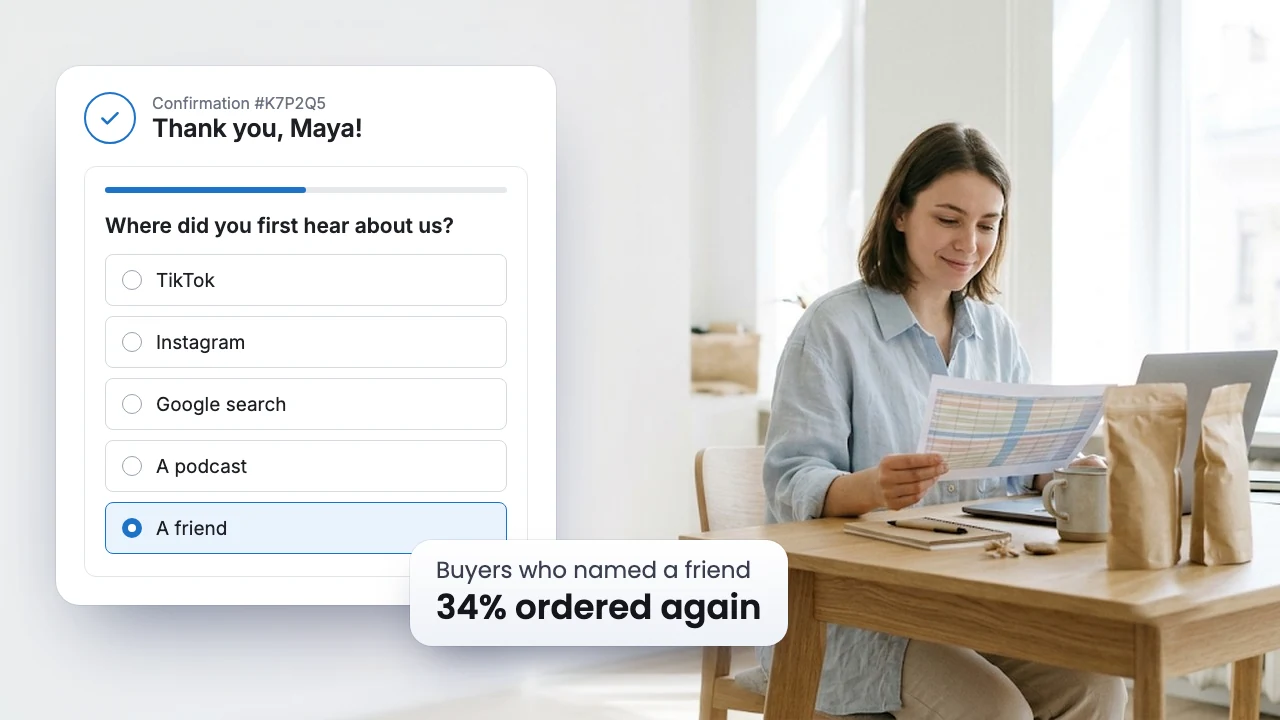
The responses add a column to every step of the ladder. They explain what happened in buyers' words, they show which channels bring buyers who come back, and they tell you what to test next.
SEA Survey is a post purchase survey app for Shopify. It asks your questions on the Thank you page, in a post purchase email or on your store, and saves each response on its order, next to its revenue. On the Growth plan, the Marketing attribution dashboard shows revenue, LTV and repeat rate by the channel buyers named, with a Cohort LTV heatmap that follows each month of new buyers for 12 months. A/B testing compares two versions of a survey, so you can keep the one more buyers answer. The Marketing attribution guide shows the setup.

SEA Survey
Listed as SEA Post Purchase Survey Quiz, 4.9 stars from 188 reviews, with the Built for Shopify badge.
30% off any paid plan for 3 monthsStarter $13.30 instead of $19, Growth $34.30 instead of $49
BFCMSEA30Last day: Dec 7
- Why now: Black Friday brings your biggest week of new buyers. Ask them how they found you, and your January numbers come with reasons.
- On the Free plan: 30 responses a month, with attribution, NPS and CSAT surveys.
- What a paid plan adds: Starter counts 500 responses a month. Growth has unlimited responses and the Marketing attribution dashboard, with revenue, LTV and the Cohort LTV heatmap by the channel buyers named, plus A/B testing and conditional logic.
- How to claim: Install SEA Survey from the Shopify App Store, open Plans, paste the code and pick Starter or Growth. Both start with a 7 day free trial.
Five habits that waste the data
- Tracking everything. Fifty numbers hide the three that moved. Start with the seven above.
- Reading numbers that feel good. Followers and page views rise easily and pay no bills. Tie each number to orders or revenue.
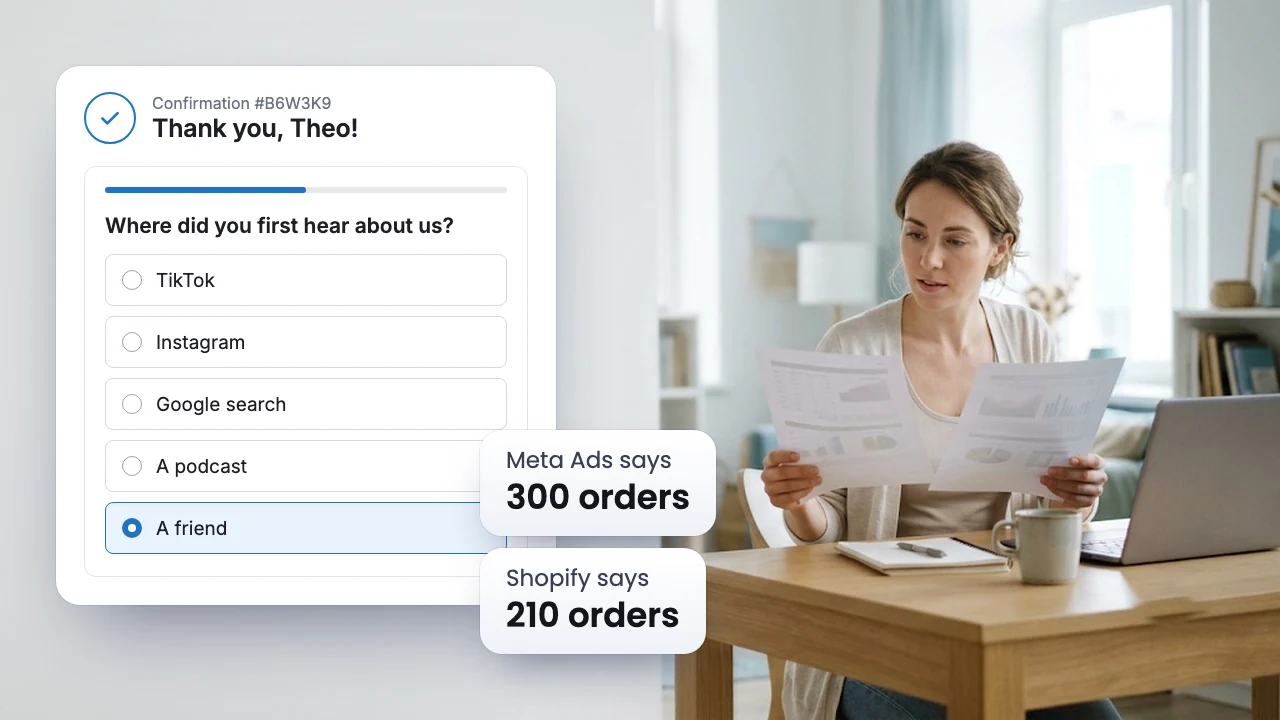
- Comparing tools that count differently. Meta, Google Ads and Shopify each use their own rules, so their totals never match. Compare each one with Shopify, not with each other.
- Trusting an average. A flat repeat rate can hide newer buyers coming back less. Split it into cohorts.
- Reading data without asking buyers. The numbers say what moved. Buyers say why.
The measurement guides
Each step of the ladder has its own guide:
- What is marketing attribution? How credit for a sale is split between channels, and why every tool splits it differently.
- Marketing attribution windows How far back each tool looks, and why one ad counts in Shopify but not in Meta.
- Why Meta says 300 orders and Shopify says 210 What each report counts, and a 20 minute check for broken tracking.
- What is cohort analysis? Which buyers come back, and what brought them.
- What is A/B testing? How to check a change before you roll it out, and how much traffic a test needs.
FAQ
What is the difference between marketing analytics and web analytics?
Web analytics measures what happens on your site, such as visits, pages and clicks. Marketing analytics uses that, plus ad reports, email results, orders and what customers say, to decide where your marketing time and money go.
What does a marketing analyst do?
A marketing analyst collects data from every channel, checks it, finds out why the numbers moved, and turns that into recommendations, such as which channel to grow or which change to test. The job mixes marketing knowledge with spreadsheet, SQL and dashboard skills.
What tools does a Shopify store need to start?
Shopify Analytics, GA4 and a spreadsheet cover what happened. Add a post purchase survey app to learn why buyers came. Larger stores add a dashboard tool such as Looker Studio once the weekly routine is in place.
How often should I review my marketing numbers?
Once a week for the routine, and every day during a sale such as Black Friday. Read cohorts and channel results monthly, because buyers need time to come back.
Do I need a survey app if I have Shopify Analytics and GA4?
They answer different questions. Shopify and GA4 see clicks and orders. A post purchase survey app asks buyers what brought them and what almost stopped them, which no report can see. Use the responses next to your reports.